A2A
The city dashboard
Open data, made actionable.
Insight
Our cities are becoming increasingly connected and smarter.
Yet, this is not always an easy roadmap. A frequent obstacle can be an inability of operators to collect, clean, interpret and act on data coming from such a connected system. Whether it’s public transportation occupancy, the status of the energy grid, traffic, pollution or safety information. There is a multiplicity of sources, formats and standards that require a huge effort to be processed and understood correctly, let alone turned into valuable information and services for citizens.

Idea
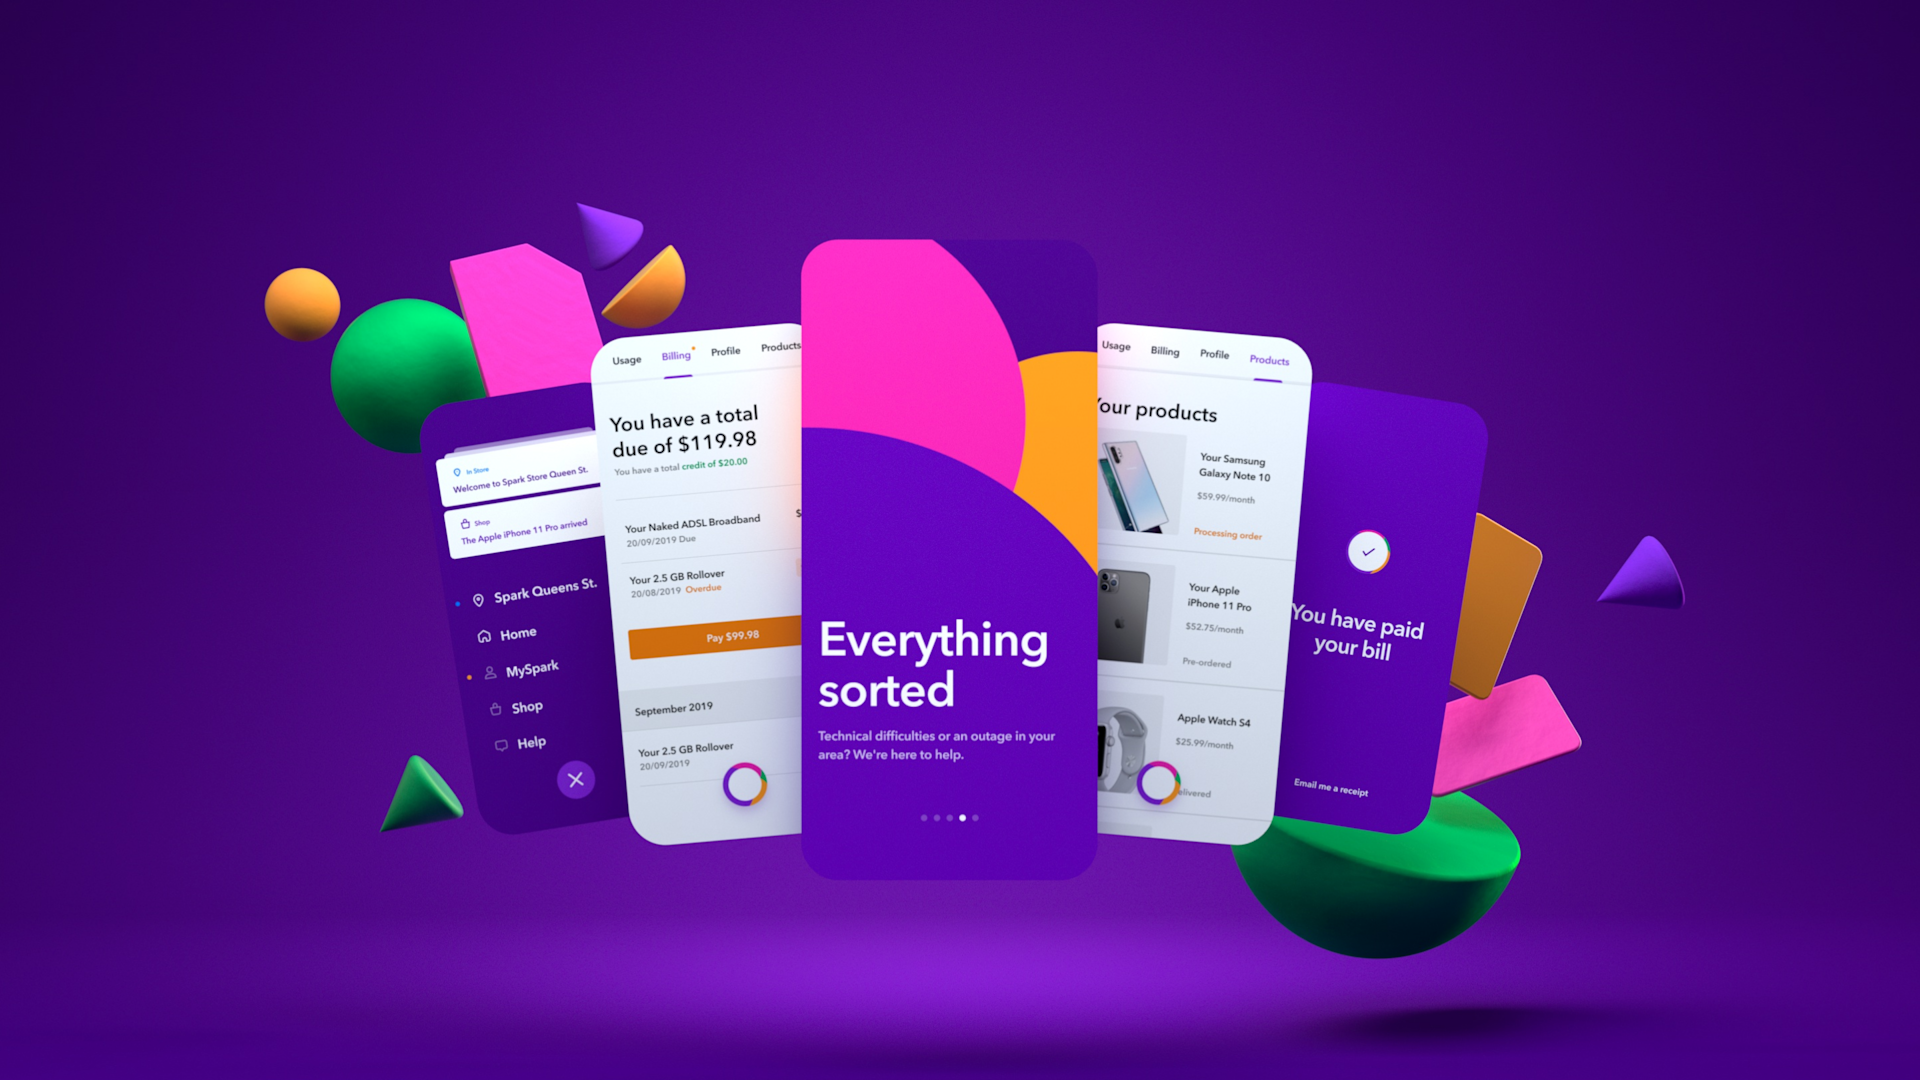
The next generation city dashboard.
The new A2A Life Company city dashboard is designed to be the single repository for all key data on the past, present and future of administrations. It serves as a platform that empowers citizens through data and a portal to access the city community life from an insider’s perspective, with the goal to create more inclusive cities.
Envisioned to meet needs and ambitions of both citizens and administrations, the platform provides an extensive set of information and connected services built on data intelligence technologies and creative storytelling.

The city dashboard allows public administrations to fully embrace trust and transparency objectives, while meaningfully engaging with citizens. It makes administration’s actions tangible and measurable.
Data will be elaborated on and made accessible in different ways according to four main driving objectives:
- Insights: translation of data into actionable and contextualised information.
- Comparison: benchmark of personal impact vs. community results (personal footprint calculator).
- Co-design: personal contribution for collective benefit (social polls).
- Activation: personal use of collective information to access public services.
While insights will be at the core of the platform, the goal is to go beyond data, considering them as a mere starting point. Services linked to data will make them actionable, and by using gamifying interactions data becomes fun and educational.
Impact
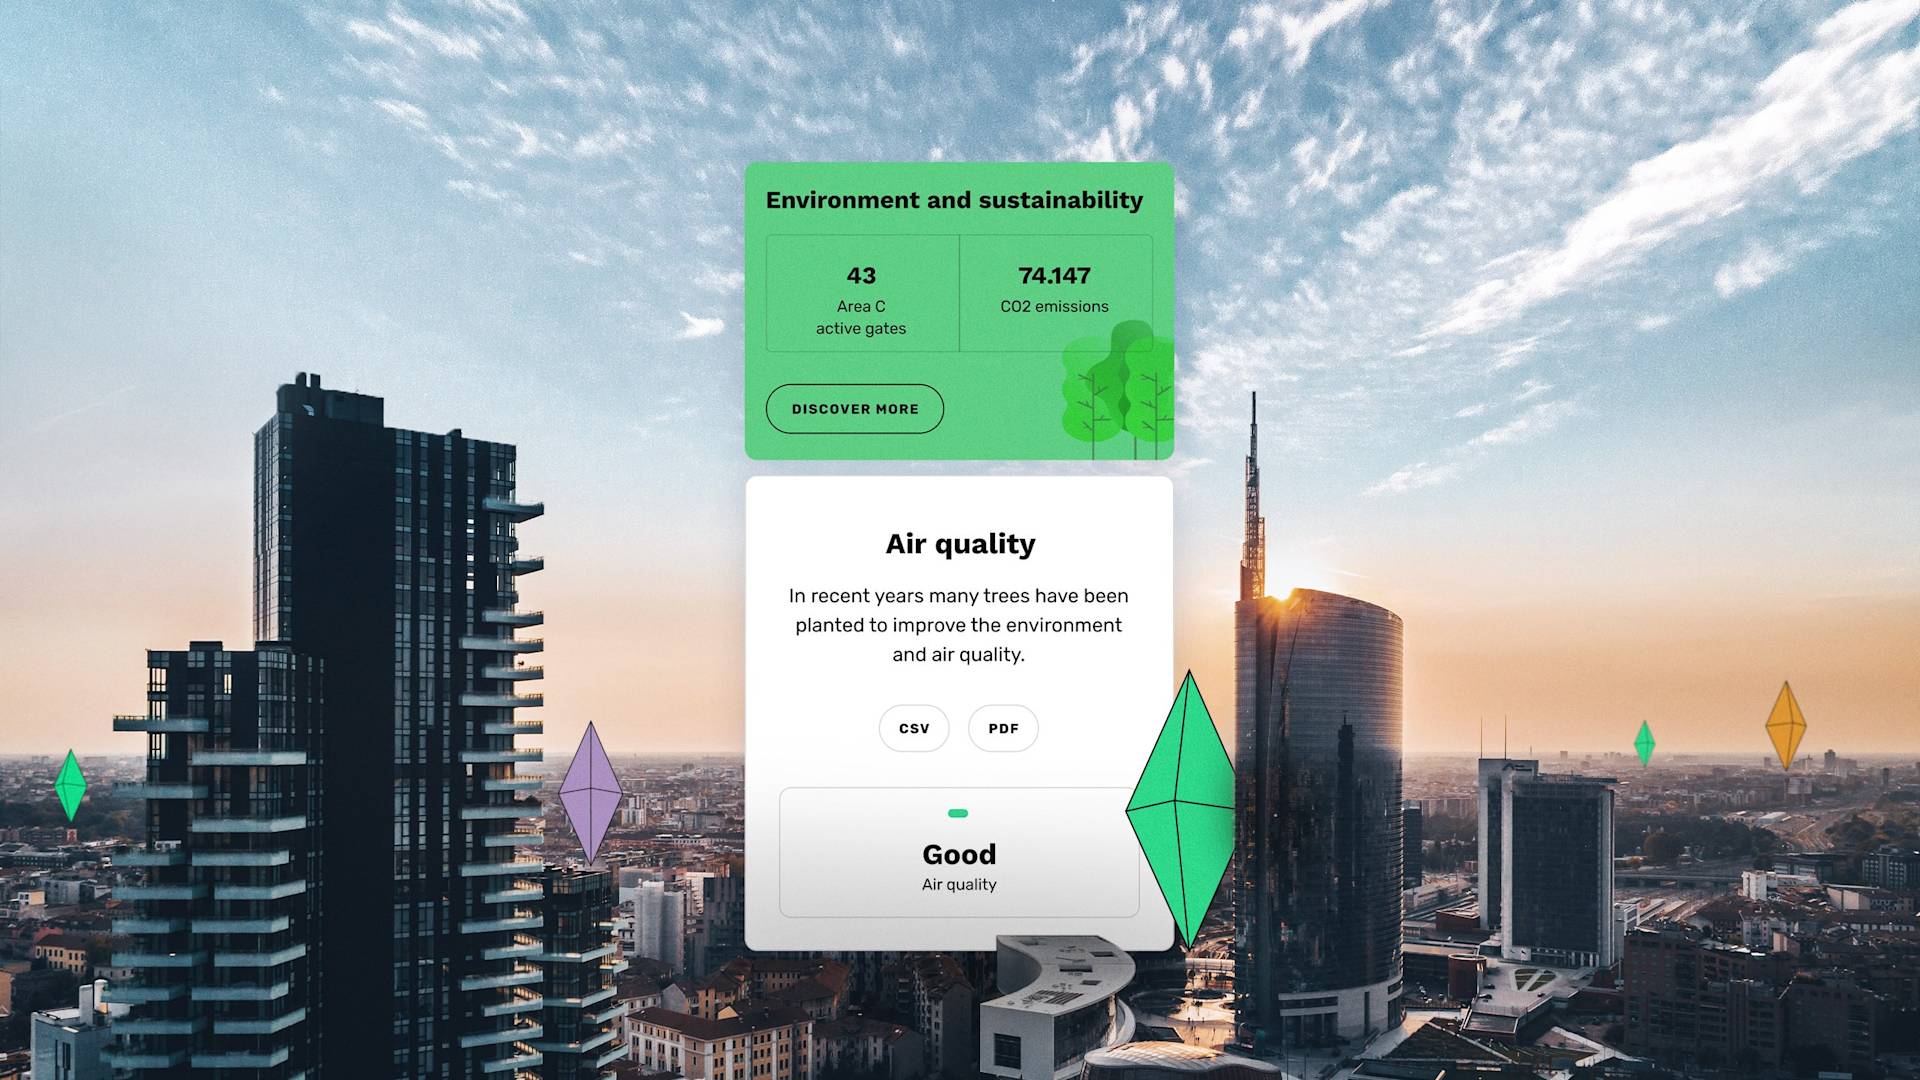
The data visualisation experience is playful and enriched by insights, stories and editorial pieces built around key metrics, which humanises the numbers and makes them more meaningful.
Advanced visitors have access to raw data, for the use of research or editorial purposes.

The dashboard is ready to be customised to suit the needs of every administration and has been created to support the broader digital system offered by A2A.
Such a design system will allow public administrations to back up vision, strategy and communication upon meaningful, relevant and data-driven insights.